India Adds 44.6 GW of Solar in One Year While US Falls Further BehindIndia Adds 44.6 GW of Solar in One Year While US Falls Further BehindIndia Adds 44.6 GW of Solar in One Year While US Falls Further BehindIndia Adds 44.6 GW of Solar in One Year While US Falls Further Behind
April 12, 2026
India installed 44.6 gigawatts of solar capacity in fiscal year 2026, a single-year addition larger than the entire solar base of most countries, according to
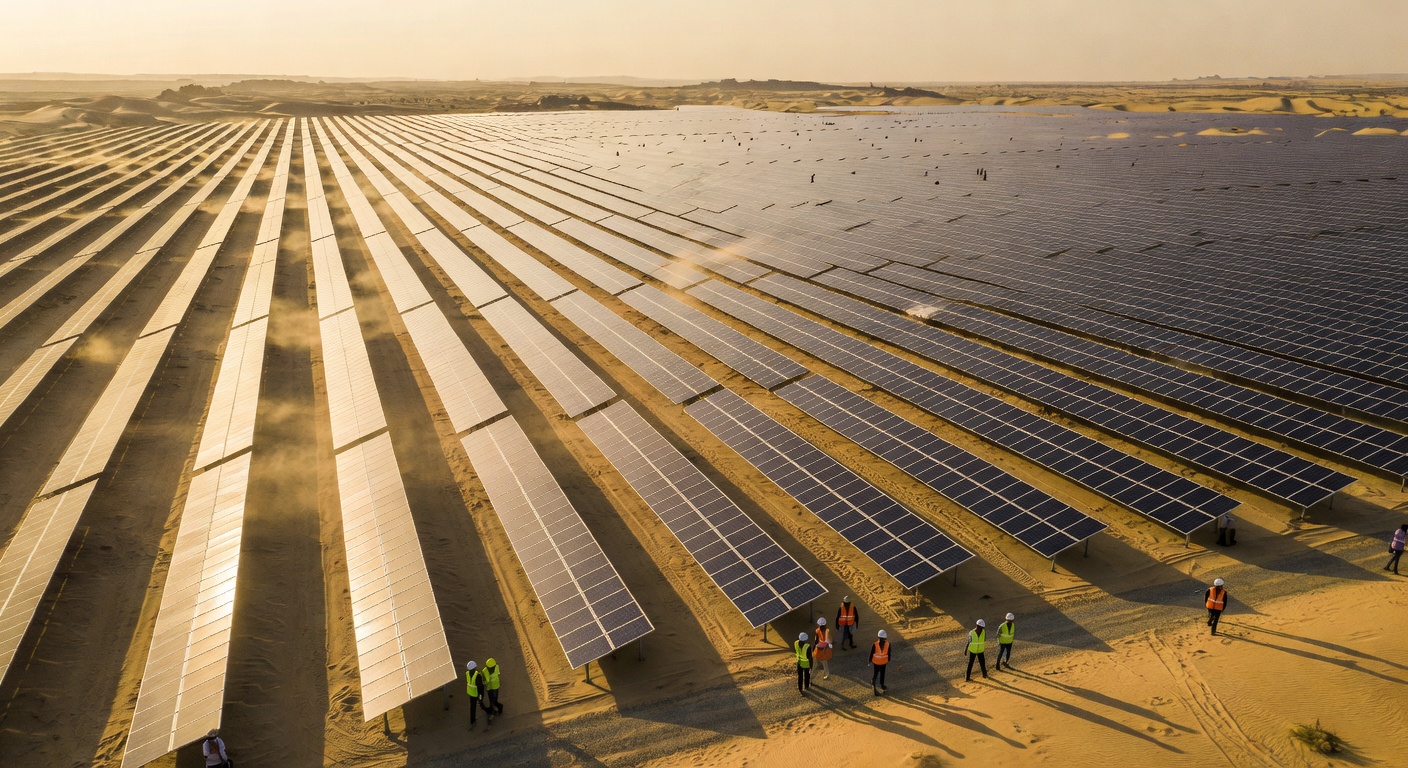
India installed 44.6 gigawatts of solar capacity in fiscal year 2026, a single-year addition larger than the entire solar base of most countries, according to CleanTechnica. That pace of deployment, combined with 6.05 GW of new wind, pushed India's total WWS capacity (wind, water, and solar combined) to 257.8 GW as of March 31, 2026, placing it firmly in the global top tier for renewable infrastructure. The surprise is not just India's velocity, but the contrast: the United States, with a GDP seven times larger and vastly superior capital markets, now sits at just 380 GW of WWS capacity, trailing not only China but Europe as well.
The global hierarchy of clean energy deployment has shifted. China dominates with 2,276 GW of WWS capacity, roughly six times the United States total. Europe holds 1,047 GW, less than half of China but still nearly three times the American figure. India's 257.8 GW may rank fourth, but the trajectory tells a different story: large-scale renewable deployment is no longer a rich-country luxury, and any conversation about the energy transition that still defaults to the US and Europe as the unquestioned center of gravity is using an old map.
What's New
India's fiscal 2026 performance marks a new phase in the global clean energy buildout. The 44.6 GW of solar added in a single year, reported by JMK Research, represents industrial-scale deployment. India's total installed solar capacity now stands at 150.26 GW, complemented by 56.09 GW of wind and 51.41 GW of large hydro, bringing the country's WWS total to 257.8 GW. With a population of 1.464 billion and a nominal GDP of approximately $4.51 trillion, India is demonstrating that renewable capacity expansion at this scale is economically viable in developing economies.
China continues to operate in a different category. By the end of 2025, China had installed roughly 640 GW of wind, 1,200 GW of solar, and 435.95 GW of hydro capacity (per the International Hydropower Association), totaling approximately 2,276 GW. That total is nine times India's, six times the United States, and more than double Europe's 1,047 GW. Europe itself remains substantial, with 304 GW of wind (per WindEurope), 262.7 GW of hydro, and an estimated 480 GW of solar as of 2025.
The United States has fallen behind. With roughly 161 GW of wind, 139 GW of solar, and 80 GW of hydro, the US total of 380 GW places it third globally. China is ahead by 1,896 GW, Europe by 667 GW. Despite continental scale, strong wind and solar resources, and a GDP of $30.6 trillion, America is losing ground.
How It Works
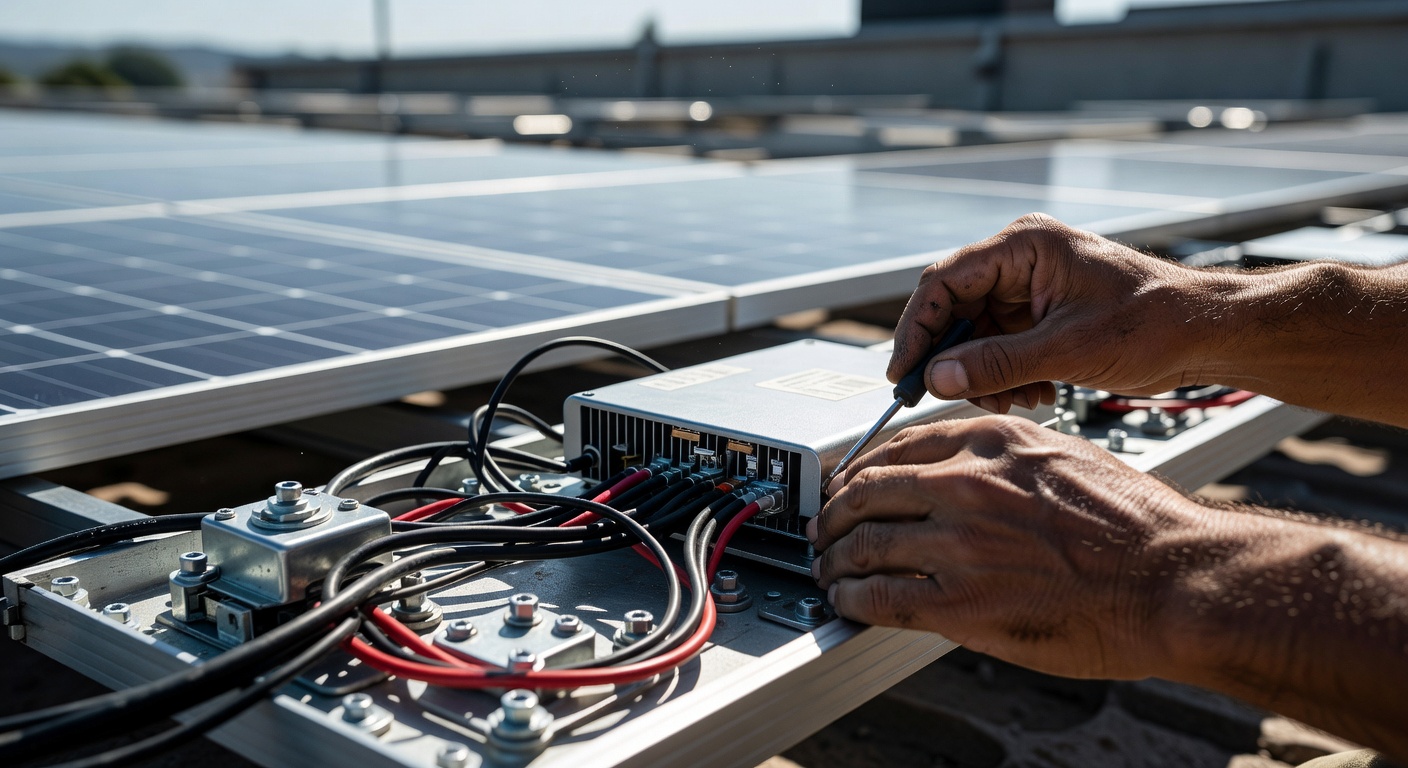
WWS capacity measures installed capacity of wind, hydroelectric, and solar generation, but does not account for capacity factors (the percentage of theoretical maximum output a plant actually produces), curtailment rates, energy storage deployment, transmission network strength, or demand response capabilities. A country with 100 GW of solar in a weak grid is not equivalent to 100 GW backed by robust storage and transmission.
Hydroelectric capacity introduces another layer of complexity. Unlike intermittent solar and wind, hydro provides dispatchable clean capacity, meaning it can ramp output up or down on demand to balance the grid. Countries with large existing hydro systems, such as Brazil (103.2 GW of hydro) and Canada (82.3 GW), are not starting from the same place as solar-heavy systems. Hydro acts as a built-in stabilizer, offering balancing value that solar and wind require batteries or grid-scale storage to replicate.
India's 51.41 GW of hydro is modest relative to its solar additions, meaning the country must solve grid integration and storage challenges at an accelerating pace. Ch
ina's 435.95 GW of hydro provides a substantial buffer, but the sheer scale of variable renewables (1,840 GW combined) still tests grid flexibility limits. The United States, with only 80 GW of hydro, has less natural balancing capacity than either China or Europe.
The Economics
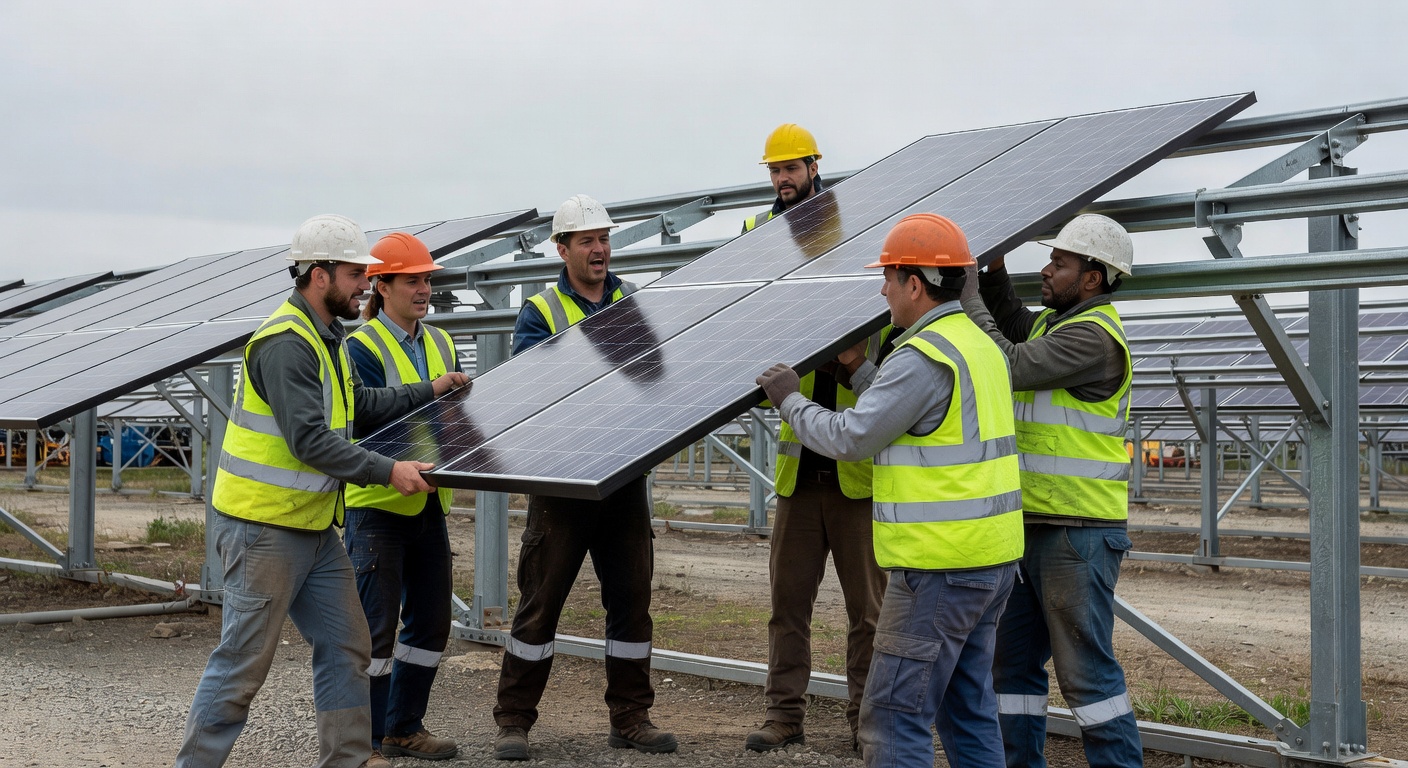
India's 44.6 GW annual solar addition demonstrates that renewable deployment at industrial scale is no longer confined to wealthy nations. With a nominal GDP of $4.51 trillion, India is building faster than countries with far larger economies. The United States, with a $30.6 trillion economy, added renewables at a fraction of India's pace. The bottleneck is not capital availability or economic development. It is policy, permitting, grid modernization, and political will.
China's economic model for renewables operates differently. The country has deployed 2,276 GW of WWS capacity through state-directed investment, domestic manufacturing dominance in solar panels and wind turbines, and centralized grid planning. The cost per gigawatt installed in China is structurally lower due to vertical integration in manufacturing and streamlined permitting.
Europe's 1,047 GW total reflects slower individual-country deployment aggregated across a continent-scale market, higher per-unit costs due to labor and environmental standards, but also more diversified supply chains and stronger grid interconnections. The European buildout has been driven by carbon pricing, renewable energy mandates, and feed-in tariffs, mechanisms that the United States has implemented inconsistently or not at all. Europe has built nearly three times the renewable capacity of the United States.
The US underperformance is not a resource constraint. It is an execution failure. With the world's largest GDP, abundant wind and solar resources, and deep capital markets, the United States should be leading.
Competitive Landscape
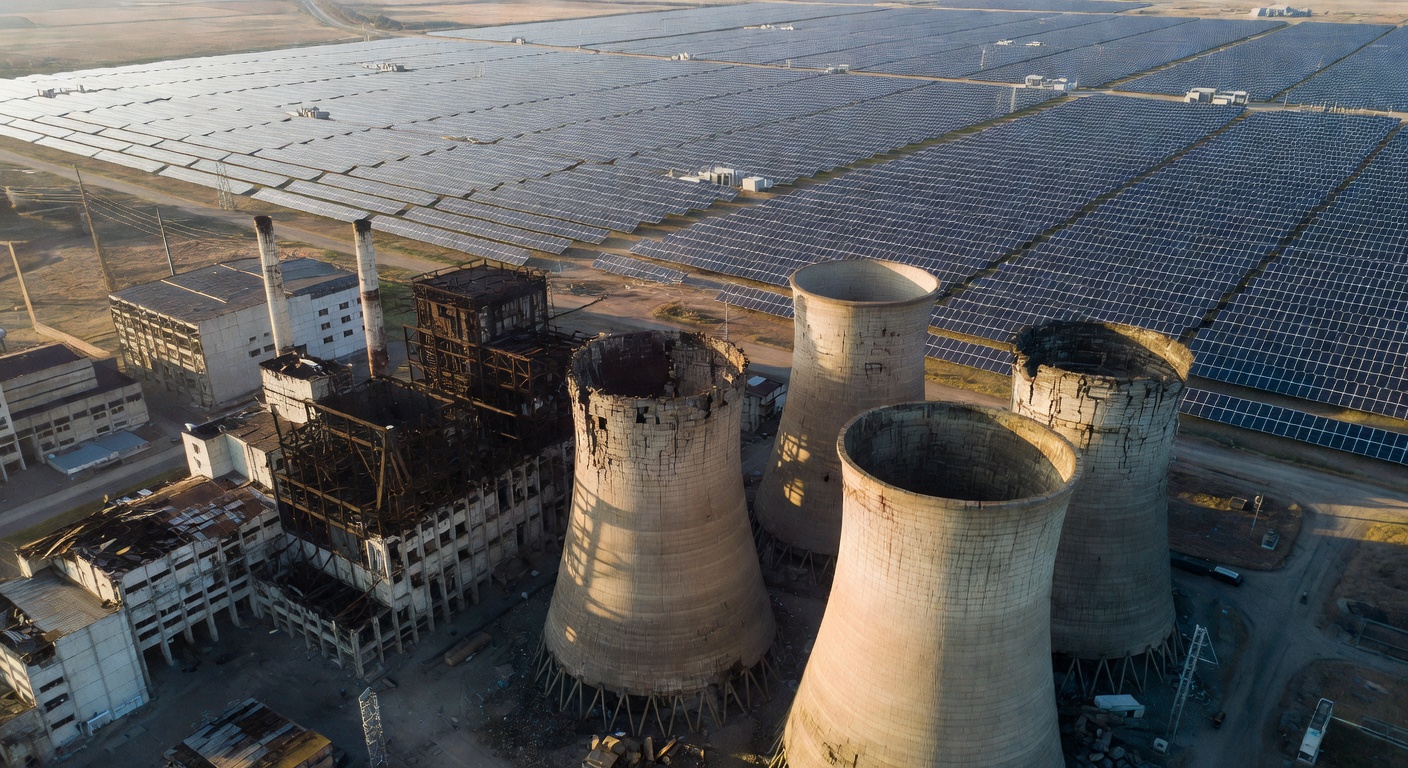
The global clean energy hierarchy is clearly stratified. China leads with 2,276 GW of WWS capacity (640 GW wind, 1,200 GW solar, 435.95 GW hydro). Europe follows at 1,047 GW (304 GW wind, 480 GW solar, 262.7 GW hydro). The United States ranks third at 380 GW (161 GW wind, 139 GW solar, 80 GW hydro). India is fourth at 257.8 GW (150.26 GW solar, 56.09 GW wind, 51.41 GW hydro).
Below the top four, Brazil emerges as a major player with 206 GW of total WWS capacity, including 68 GW of solar, 34.8 GW of wind, and 103.2 GW of hydro. Canada follows with approximately 107.3 GW, heavily weighted toward hydro at 82.3 GW, with 18.4 GW of wind and 6.6 GW of solar. Spain and Pakistan are noted as more substantial contributors than expected.
China's lead over the United States is 1,896 GW, a gap larger than the entire WWS capacity of Europe. Europe's lead over the United States is 667 GW, nearly double the US total. India, despite having a GDP less than one-seventh that of the United States, is closing the gap rapidly. If India sustains its current pace of 44.6 GW of solar per year, it could surpass the United States in total WWS capacity within a decade.
The competitive picture is not static. China continues to add capacity at a rate that dwarfs all other countries. India's trajectory is accelerating. Europe's buildout has slowed but remains substantial. The United States is adding capacity but at a pace that guarantees it will fall further behind.
What's Next
India's fiscal 2026 performance signals that the country will remain a top-tier renewable builder for the foreseeable future. Sustaining 44.6 GW of solar additions annually will require continued policy support, grid infrastructure investment, and manufacturing capacity expansion, but the economic case is clear. China's dominance is solidifying, with no indication that its deployment pace will slow. Europe's buildout, while substantial, is unlikely to accelerate enough to close the gap with China.
The United States faces a choice. Current policy and deployment rates guarantee that America will remain fourth or lower in global renewable capacity rankings, falling further behind China and Europe while watching India close the gap. The challenge is not technological or economic. It is institutional. The US grid is fragmented across regional operators, permitting timelines stretch for years, and federal renewable policy oscillates with each administration. Until those structural barriers are addressed, the US will continue to underperform relative to its resources and economic capacity.
The center of gravity in the global energy transition has already shifted. Any analysis that treats the United States and Europe as the default leaders is outdated. China is setting the pace. India is proving that rapid deployment is achievable at scale in developing economies. The United States built the global technology industry, dominates aerospace, and leads in software and artificial intelligence. It should not be trailing in clean energy infrastructure. The gap between American potential and American performance is widening.
-- Raj Malhotra, Market Analysis Director
Sources: CleanTechnica
More on Revuzia
SpaceX launches Cygnus XL with 11,000 pounds of cargo to ISS
Quantum computer breakthrough tracks qubit fluctuations in real time
More on Revuzia
Suniva Plans 564-Job Solar Manufacturing Facility in South Carolina
USC Roboticist Maja Mataric Turns Autism Therapy Robots Toward Campus Mental Health
Algorithmiq Raises EUR 18 Million, Beats Harvard and Stanford on Quantum Drug Simulation